by Martin J. Greenberg and Michael R. Gavin
Introduction
“There’s a[n unsupported] belief . . . that baseball is a dying game. But the numbers indicate otherwise. Baseball isn’t dying. In fact, the values of [Major League Baseball (MLB)] teams are growing at an astounding rate.”[1] This is evidenced by the 2012 sale of the Los Angeles Dodgers (Dodgers). Entering the 2012 regular season, the Dodgers were valued by Forbes at approximately $1.4 billion.[2] In May of 2012, Dodgers owner Frank McCourt sold the team to Guggenheim Baseball Management, which includes Basketball Hall of Famer Magic Johnson as one of the principal owners.[3] The reported sale price was $2 billion.[4] By simply looking at this transaction, one could reasonably conclude that Guggenheim Baseball Management overpaid for the Dodgers by $600 million. However, what this transaction did was skyrocket the value of every single MLB franchise, where between the 2012 and 2013 baseball seasons, each team’s value increased by approximately thirty-five percent (35%).[5]
 When Forbes published its annual valuation of MLB teams in 2015, the conclusion was obvious: baseball has never been so profitable and teams have never been so valuable. According to the 2015 Forbes valuations, the average MLB team was worth $1.2 billion, which was, according to Forbes, forty-eight percent (48%) higher than the average value of a MLB team in 2014 ($811 million).[6] In 2014 only five teams were valued at $1 billion or more by Forbes;[7] whereas fifteen teams were valued at $1 billion or more in the Forbes 2015 valuations.[8] The forty-eight percent (48%) increase in value over the 2014 valuations was the highest one-year increase since Forbes began tracking team values in 1998.[9] If MLB was traded on a stock exchange, it would have been worth approximately $36 billion in 2015, according to Forbes.[10] The 2015 Forbes valuations showed that each MLB team increased in value, on average, by at least twenty percent (20%).[11]
In March of 2016, Forbes released its annual valuation of MLB teams, reporting that the average MLB team is now worth $1.3 billion, up eight percent (8%) from 2015 and sixty percent (60%) higher than in 2014.[12] Seventeen teams were valued at $1 billion or more.[13] The top ten teams, according to the 2016 Forbes report based on the teams’ value as well as their percentage change from 2015, are as follows:[14]
| Rank | Team | Value (in billions) | Value Change (%) |
| 1 | New York Yankees | $3.4 | 6 |
| 2 | Los Angeles Dodgers | $2.5 | 4 |
| 3 | Boston Red Sox | $2.3 | 10 |
| 4 | San Francisco Giants | $2.25 | 12 |
| 5 | Chicago Cubs | $2.2 | 22 |
| 6 | New York Mets | $1.65 | 22 |
| 7 | St. Louis Cardinals | $1.6 | 14 |
| 8 | Los Angeles Angels | $1.34 | 3 |
| 9 | Washington Nationals | $1.3 | 2 |
| 10 | Philadelphia Phillies | $1.235 | -1 |
MLB revenues for the 2015 season for the thirty (30) MLB teams were a combined $8.4 billion according to Forbes, seven percent more than the previous season.[15] During the past five years, MLB team values have increased a staggering 146 percent (146%) according to Forbes.[16]
After looking at this information provided by Forbes, the key question then is: why are MLB teams’ values skyrocketing at such a high rate? This article will seek to answer this question by looking at a variety of factors that have influenced the value of MLB teams and will examine these factors in terms of the Milwaukee Brewers (Brewers). Explaining and understanding the Forbes valuation methodology is where this article will begin. We will then review other factors to explain the increase in MLB franchise values, including: (1) former MLB Commissioner Bud Selig’s leadership and vision; (2) national television deals; (3) local television deals and regional sports networks; (4) MLB.TV “Follow Your Team;” (5) Major League Baseball Advanced Media (MLBAM); (6) the Competitive Balance Tax; (7) MLB’s Revenue Sharing Program; (8) actual reported sales of MLB teams; (9) the creation of new state-of-the-art facilities; (10) ticket sales and stadium attendance; (11) labor peace; (12) the psychic value of owning a MLB team; (13) the internationalization of the game—i.e. the World Baseball Classic; and (14) the viability of MLB’s debt and credit line. Finally, this article will offer a perspective on the Brewers and how the increase in values has affected this particular franchise.
Forbes Valuation Methodology
Forbes franchise values are considered “enterprise values,” which are computed as equity plus net debt.[17] Net debt is computed by adding a team’s short-term debt plus the team’s long-term debt, and then subtracting the team’s cash and cash equivalents (Net Debt = [Short-term Debt + Long-term Debt] – [Cash + Cash equivalents]).[18] Cash equivalents are highly-liquid, low-risk investments that mature in three months or less.[19] Cash equivalents must be unrestricted, meaning that those investments must be available for immediate use.[20] Examples of cash equivalents include commercial paper, marketable securities, money-market funds, short-term government bonds, and treasury bills.[21] Simply put, Forbes determines MLB franchise values based on the following criteria:
- The team’s revenue earned through MLB’s Revenue Sharing Program;
- The team’s city and market size;
- The value of the team’s stadium; and
- The team’s brand value.[22]
Additionally, Forbes adjusts their franchise valuations by considering:
- Revenue multiples of prior transactions;
- If the team acquires a new ballpark;
- Completed television deals beginning on a future date;
- Revenues from baseball events, which consist of ticket and premium seating sales, media, concessions, merchandise, licensing sales, and distributions from MLB’s central fund;
- Revenues from non-baseball stadium events, such as concerts and non-baseball sporting events, like the National Hockey League’s (NHL) annual Winter Classic outdoor hockey game;
- “Revenue is net of annual stadium debt service for which the team is responsible, as well as money teams receive, or pay, as part of the league’s local revenue-sharing system;” and
- Luxury payroll taxes paid to MLB are subtracted from the team’s operating income.[23]
For example, using the main criteria for franchise valuation, the Brewers received a team value of approximately $875 million from Forbes in 2016.[24] Under Forbes’ valuation breakdown, the Brewers’ revenue earned through MLB’s Revenue Sharing Program was $347 million.[25] Additionally, the City of Milwaukee and its market were valued at $275 million; the value of Miller Park, the Brewers’ ballpark, was valued at $175 million; and the Brewers’ brand was valued at $81 million.[26] In total, this criteria’s values amounted to $878 million, which is very close to the $875 million team value ascribed by Forbes.
Although Forbes provides the public with a solid overview of MLB franchise values, they intentionally exclude equity interests in other assets that would increase a team’s value.[27] For example, Forbes excludes a team’s equity interests in its regional sports network or its concession businesses.[28] A team that is undervalued because of Forbes’ practice of excluding equity stakes in regional sports networks, for instance, is the Baltimore Orioles (Orioles). The Orioles contracted with the Mid-Atlantic Sports Network (MASN) in 2006, and the deal permits MASN to locally televise the Orioles’ baseball games for a $29 million per year annual rights fee.[29] In addition to the $29 million annual rights fee, the Orioles have an eighty-six percent (86%) equity stake in MASN.[30] Thus, the Orioles are entitled to 86% of the net profits MASN generates, with the remaining fourteen percent belonging to the Washington Nationals.[31] The revenues for the Orioles could amount to a significant sum of money, and along with their equity interest in MASN, the Orioles’ franchise value and a future purchase price would likely further increase.
Key Factors Impacting Franchise Values
- Former MLB Commissioner Bud Selig’s Leadership and Vision
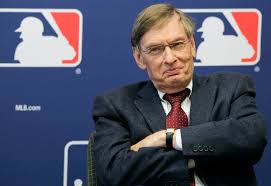
The first key factor in explaining why MLB franchise values are skyrocketing is attributable to Commissioner Emeritus Bud Selig (Selig). Selig’s twenty-two year tenure as Commissioner was the second longest in MLB history, with only Judge Kenesaw Mountain Landis serving longer (1920-1944).[32] Selig’s impact on franchise values and baseball during his term as Commissioner is profound. During his tenure, Selig brought dramatic and positive changes to MLB that not only improved the game, but also the economics of the game, which include:[33]
The Game
- Unbalanced schedule;
- Interleague play;
- Three-division formats in the American and National Leagues;
- An extra tier of playoffs and the Wild Card;
- First phase of realignment;
- Consolidation of the administrative functions of the American and National Leagues into the Commissioner’s Office;
- The restoration of the rulebook strike zone; and
- Awarding of home field advantage in the World Series to the team from the league that won the All-Star Game.[34]
The Economics
- Debt Service Rule;
- Revenue sharing;
- Competitive Balance Tax;
- Tremendous growth in industry revenues;
- Increased popularity of the game;
- Record franchise values; and
- Labor peace.
However, Selig’s most important accomplishment, which greatly impacted franchise values, was the 2002 labor agreement between MLB and the Major League Baseball Players Association (MLBPA) that avoided a work stoppage and provided significant economic concessions to the teams.[35] These concessions brought about competitive balance among the teams. Selig also engineered subsequent labor deals, including the five-year labor agreement in 2006, which was the longest agreement in baseball history.[36] Without Selig’s steady hand, MLB could have experienced a replay of the 1994/1995 strike, the longest such work stoppage in MLB history. But Selig has avoided lockouts and strikes, and by virtue of such avoidance has helped MLB maintain its value, brand, and popularity among fans.
- National Television Deals


The next important factor in the increased valuation of MLB franchises is national television deals. At the beginning of the 2014 MLB season, the new national television contracts between MLB and FOX, TBS, and ESPN commenced.[37] These contracts generate a reported $1.5 billion in revenue annually for eight years (through the 2021 season),[38] with the revenue generated becoming a part of MLB’s Central Fund, which is distributed equally among all thirty MLB teams with each team receiving approximately $50 million.[39] The revenue generated from these new national television contracts are twice as much as the previous contracts, where the total revenues per year were $750 million, and each team, on a pro rata basis, received approximately $25 million annually.[40] With this national television revenue increase, an MLB team becomes more valuable because a buyer can count on the team’s share of the increased lucrative television revenues through the 2021 season.
- Local Television Deals and Regional Sports Networks
Local television deals with regional sports networks (RSNs) also drive up the value of MLB teams. For RSNs, their most valuable characteristics are equity stakes and shared profits.[41] In MLB, fifteen teams in the United States possess equity interests in a RSN that controls the team’s local television rights.[42] Some of these contracts with RSNs are very lucrative and can potentially generate a substantial amount of revenue for years to come. As of this publication, the following teams have an equity stake in a RSN:[43]
| MLB Team | RSN | Team’s Ownership Interest | Average Annual Rights Fee | Current Deal Expiration |
| Arizona Diamondbacks | Fox Sports (FS) Arizona | Unknown | $80 million | 2035 |
| Baltimore Orioles | MASN | 86% | $29 million | N/A |
| Boston Red Sox | New England Sports Network (NESN) | 80% | $60 million | N/A |
| Chicago Cubs | Comcast SportsNet (CSN) Chicago/WGN | 20% | $50 million (combined) | WGN: 2015; CSN Chicago: 2019 |
| Chicago White Sox | CSN Chicago | 40% | $45.5 million | 2019 |
| Houston Astros | Root Sports Southwest | 45% | $80 million | 2032 |
| Los Angeles Angels | FS West | 25% | $150 million | 2032 |
| New York Mets | SportsNet New York | 65% | $68 million (plus annual increase) | 2030 |
| New York Yankees | YES | 25% | $95 million (plus 5% annual increase) | 2042 |
| Philadelphia Phillies | CSN Philly | 25% | $52.45 million (plus 5% increase per year) | 2040 |
| San Diego Padres | FS San Diego | 20% | $60 million | 2031 |
| San Francisco Giants | CSN Bay Area | 35% | $30 million | 2032 |
| Seattle Mariners | Root Sports Northwest | 71% | $115 million | 2030 |
| Texas Rangers | FS Southwest | 10% | $150 million | 2034 |
| Washington Nationals | MASN | 14% | $29 million | N/A |
As shown above, the Orioles, Red Sox, Mets, and Mariners are the majority owners of their respective RSNs.
What potentially makes these local television arrangements so lucrative are (1) equity interests; (2) coupled with the right to share in the net profits; and (3) most importantly, not having to share carriage fees revenue.[44] Carriage fees are simply described as the price that a network charges to a cable service provider in order for the provider to carry the network’s programming.[45] An RSN typically earns anywhere from two to three dollars per month per subscriber in carriage fees, and the fees can be much higher depending on the network, such as Spectrum SportsNet LA (the Dodgers’ RSN, formerly Time Warner Cable SportsNet LA), which charges a carriage fee of $4.90 per month.[46]
 One benefit for an MLB team that has an equity interest in an RSN is that they do not have to share their revenue earned through carriage fees.[47] As mandated in MLB’s Basic Agreement (CBA), all thirty teams must submit thirty-four percent (34%) of their RSN revenues to MLB’s revenue sharing fund.[48] Because carriage fees are not subject to MLB’s Revenue Sharing Program, millions of dollars are retained by the MLB team.
An MLB team that does not possess equity in an RSN may not be considered as valuable as teams with equity in RSNs because they are not entitled to any of the net profits an RSN generates. Additionally, referencing the table below, teams that do not have an ownership interest in an RSN for the most part do not have as high of an average annual rights fee compared to their counterparts that possess equity in an RSN.
| MLB Franchise[49] | RSN | Average Annual Rights Fee | Current Deal Expiration |
| Atlanta Braves | FS South | $20–30 million | 2031 |
| Cincinnati Reds | FS Ohio | $30 million | 2017[50] |
| Cleveland Indians | SportsTime Ohio | $40 million | 2022 |
| Colorado Rockies | Root Sports Rocky Mountain | $20 million | 2020 |
| Detroit Tigers | FS Detroit | $40 million | 2017 |
| Kansas City Royals | FS Kansas City | $20 million | 2019 |
| Los Angeles Dodgers | Spectrum SportsNet LA | $320 million | 2038 |
| Miami Marlins | FS Florida | $18 million | 2020 |
| Milwaukee Brewers | FS Wisconsin | $20 million | 2019 |
| Minnesota Twins | FS North | $29 million | N/A |
| Oakland Athletics | CSN Bay Area | $43–48 million | 2029 (opt-out after 2023) |
| Pittsburgh Pirates | Root Sports Pittsburgh | $18 million | 2019 |
| St. Louis Cardinals | FS Midwest | $25–28 million | 2017 |
| Tampa Bay Rays | SunSports | $20 million | 2016 |
| Toronto Blue Jays | Rogers SportsNet | $36 million | N/A |
- TV “Follow Your Team”
In January 2016, a class action suit involving a group of fans, MLB, Comcast Corp., and DirectTV was settled.[51] The fans maintained that when MLB granted “exclusive broadcast rights to regional networks and barr[ed] teams from broadcasting or streaming games outside their home territories[,] . . . the arrangement inflated prices, restricted choice[,] and violated [United States] antitrust law.”[52] As a result of the settlement, MLB agreed to offer two internet television packages: (1) a single-team package for about $85 annually; and (2) a full television package, which allows a consumer to watch every game, for $110 annually.[53] MLB is expected to roll out the “Follow Your Team” MLB.TV package in the near future, which allows consumers to view a particular team’s out-of-town telecast when the particular team is playing in the viewer’s area.[54] For example, a Pittsburgh Pirates fan living in Milwaukee, Wisconsin could watch the Pittsburgh broadcasters call a game against the Brewers without the game being subject to a black out. The “Follow Your Team” package costs ten dollars per season in addition to the $110 MLB.TV cost, allowing consumers to view the home broadcasts of every MLB game, and the package is only available to consumers “who subscribe to a pay TV service that carries the local team broadcasts.”[55]
Even though MLB settled the lawsuit, they were still considered a partial winner in the settlement because MLB was planning to offer discounted single-team packages.[56] The single-team package is expected to provide significant revenue for MLB and potentially its teams. Pursuant to MLB’s Revenue Sharing Program, the teams will share equally in the revenue earned through both the MLB.TV packages and “Follow Your Team.”
- Major League Baseball Advanced Media (MLBAM)
 MLBAM was established in 2000 after a unanimous vote by all thirty teams, and serves as MLB’s internet and interactive media arm.[57] MLBAM’s role is to manage MLB’s and its teams’ websites, which include content such as team schedules, standings, scores, and statistics, along with live full-game audio and video streaming for their subscribers.[58] MLBAM is able to earn revenue from three sources: (1) subscription fees; (2) advertising and sponsorship revenue; and (3) ticket sales from its tickets.com subsidiary.[59]
MLBAM has been a profitable business venture for MLB. In 2000, MLB teams organized MLBAM as a limited partnership and invested $75 million into the media arm.[60] In 2015, MLBAM reportedly earned $800 million in revenue, and Forbes projected that MLBAM would earn between $1.1–$1.2 billon in 2016.[61] This represents a $300–$400 million increase, or a thirty-seven and a half percent (37.5%) to fifty percent (50%) increase in revenues. In addition to its staggering revenue growth, MLBAM recently became a prime target for outside companies to acquire an ownership interest in MLB’s media arm. In July of 2016, the Walt Disney Company announced that they acquired a one-third (33.3%) ownership stake in MLBAM’s spin-off media company, BAMTech, for $1 billion, along with an option to become a majority shareholder in the future.[62] Shared equally, each team will receive $33.3 million from the sale.
 MLBAM is such an attractive commodity that other major sports leagues want to improve their product distribution by utilizing MLBAM’s model. In August of 2015, MLBAM and the NHL announced a six-year digital media rights partnership, where a digital hub will be created to provide “video, live game streaming, social media, fantasy, apps,” and statistical and analytical content to the NHL’s consumers.[63] The key features of this deal include the following:[64]
- MLBAM receives exclusive rights to distribute live, out-of-market NHL telecasts in the United States and certain international markets, including via the NHL GameCenter LIVE subscription service[;]
- MLBAM receives exclusive rights to distribute live, out-of-market telecasts via the NHL Center Ice subscription service in the United States to cable, satellite and over-the-air broadcaster[; and]
- MLBAM receives exclusive rights to operate the NHL Network as an agent for the NHL. The NHL Network’s daily on-air operations will be based out of MLB Network’s headquarters in Secaucus, N.J.[65]
 Also, the NHL and its teams retain editorial control of its content on all its platforms, and the “NHL and MLBAM will partner on the design and development of new digital products and platforms.”[66] Further, the NHL acquired an ownership interest in BAMTech rumored to be just under ten percent.[67] By expanding to another professional sports league, MLBAM is tapping into a new source of revenue by exploring digital media opportunities of other leagues, and in turn will make itself more profitable.
In November of 2016, Discovery Communications and BAMTech entered into a long-term partnership that featured creating BAMTech Europe.[68] “The new subsidiary will be a digital technology provider that will see them working with content owners, broadcasters[,] and OTT platforms to enhance their digital capabilities, reach[,] and performance across Europe.”[69] With this new deal, EuroSport Digital, an entity controlled by Discovery Communications, will become BAMTech Europe’s first client.[70] As a result, EuroSport Digital will have access “to select European sports rights from worldwide sports properties, including current and future rights acquired by BAMTech and jointly by [E]uroSport and BAMTech.”[71]
MLBAM is becoming a dominant player not only in the sports industry, but in corporate America as well. MLB’s branding through MLBAM has paid dividends, and MLBAM is the model that other professional sports leagues want to emulate. With former MLB Commissioner Selig obtaining the unanimous vote of the team owners to greenlight MLBAM, it shows the explosive, dynamic leadership that MLB has. With MLBAM being an astounding product and producing its incredible return on investment, corporations easily invest in MLBAM to enjoy similar success.
- MLB’s Competitive Balance Tax
 Because MLB does not have a salary cap, MLB uses a Competitive Balance Tax, also known as a luxury tax, to prevent the large-market, high-payroll teams from gaining a significant competitive advantage over the small-market teams, who usually have lower payrolls.[72] The large-market teams typically sign the available, high-priced free agents because they have the required cash to sign these costly free agents. As a result, the luxury tax effectively punishes those teams that exceed a certain payroll amount.[73] “Any MLB team whose payroll exceeds the threshold at the end of the season will be taxed a percentage of the exceeding amount. The tax rate is completely dependent on the MLB team’s tax history. Teams that have been ‘repeat offenders’ are subject to paying a higher tax rate.”[74] The following information shows the luxury tax thresholds under the 2012–2016 CBA and how the tax was calculated for MLB teams that exceed the luxury tax thresholds:[75]
2012–2016 CBA Competitive Balance Tax Thresholds
| Year | Threshold |
| 2012 | $178 million |
| 2013 | $178 million |
| 2014 | $189 million |
| 2015 | $189 million |
| 2016 | $189 million |
2012–2016 CBA Competitive Balance Tax Rates
- Seventeen and a half percent (17.5%) percent tax if the team did not exceed the luxury tax threshold in 2012.
- Thirty percent (30%) tax if the team exceeded the luxury tax threshold in 2012 and paid twenty percent (20%).
- Forty percent (40%) tax if the team exceeded the luxury tax threshold both in 2011 and 2012, meaning they paid thirty percent (30%) in 2012.
- Fifty percent (50%) if the team exceeded the luxury tax threshold in the last few years and they paid anything over forty percent (40%).[76]
The rule was simple: if a team exceeded the luxury tax threshold, the team paid the tax, and if the team exceeded the luxury tax threshold in multiple years, the team would pay an additional tax.[77] If a team avoided paying the luxury tax, their rate resets back to 17.5% for the next time they exceed the luxury tax threshold.[78] For the 2016 season, the luxury tax threshold was $189 million.[79] During the 2016 season, six teams exceeded the $189 million threshold, more than ever before, and are required to pay the total sum of $74 million on the basis of the Competitive Balance Tax for the 2016 season. Those six teams were:
The Dodgers ($31.8 million); Yankees ($27.4 million); Red Sox ($4.5 million); Tigers ($4 million); Giants ($3.4 million); and Cubs ($2.96 million). The Dodgers and Yankees are multi-year offenders, so they both are paying 50% tax on the overage. It is the fourth straight year that the Dodgers have had to pay and the fourteenth for the Yankees.[80]
Under the new 2017–2021 CBA, the luxury tax system slightly changed to include new payroll thresholds and tax rates. Those changes are illustrated below:[81]
2017–2021 CBA Competitive Balance Tax Thresholds
| Year | Threshold |
| 2017 | $195 million |
| 2018 | $197 million |
| 2019 | $206 million |
| 2020 | $208 million |
| 2021 | $210 million |
2017–2021 CBA Competitive Balance Tax (CBT) Rates
| Number of Times Team Exceeded CBT Threshold | Tax Rate |
| 1 | 20% |
| 2 | 30% |
| 3+ | 50% |
Under the new CBA, there will now be surtaxes on top of the luxury taxes. Those surtaxes are illustrated below:[82]
| First-time Payor | Second-time Payor | Third or more times Payor | |
| Surtax on Payroll Between $20–40 million above CBT Threshold | 12% | 12% | 12% |
| Surtax on Payroll Exceeding CBT Threshold by over $40 million | 42.5% | 45% | 45% |
Further, beginning in 2018, MLB teams that exceed the luxury tax threshold by over $40 million will have their first selection in the Rule 4 Draft moved back ten places, except for teams who possess one of the first six selections in the Draft.[83] Teams that have a top-six selection will have their second highest selection moved back ten selections instead.[84] These changes in the luxury tax system will be in full effect in 2018, and will be phased in during the 2017 season.[85]
Former MLB Commissioner Selig touts the Competitive Balance Tax as his defining legacy in his role as Commissioner.[86] This tax allows small-market teams to compete with large-market teams in an era where dollars drive everything.[87] This allows teams to have what Selig calls “hope and faith” at the beginning of each year that their team could make the postseason.[88] The Competitive Balance Tax under Selig’s tenure as Commissioner produced incredible results:[89]
- During the 2013 and 2014 postseasons, thirteen of the thirty MLB teams have played at least one postseason series.
- From 2010 to 2014, twenty of the thirty MLB teams have made a postseason appearance.
- From 2008 to 2014, six different American League teams have won the American League Pennant.
- From 2001 to 2014, eight different franchises have won the World Series.
- The average playoff payroll rank of the World Series winners from 2005 to 2014 is eighth. During this time, the team with the highest payroll has won just once (2009 New York Yankees).
- In 2014, three of the top five payroll teams and six of the top eleven payroll teams missed the postseason.[90]
In addition to the luxury tax, the 2012-2016 CBA provided for the Competitive Balance Lottery. The CBA allowed ten teams with the lowest revenues or ten teams in the smallest markets to enter in a lottery to potentially acquire one of the six draft pick selections that followed the first round of the annual First-Year Player Draft.[91] Under the new CBA, Competitive Balance Selections will still be awarded to teams in the ten lowest markets or smallest ten teams in local revenue “based on a combination of winning percentage and local revenue.”[92] However, the lottery system was scrapped “in favor of a system in which the eligible Clubs will receive selections after the first round or after the second round in alternating years.”[93]
- MLB’s Revenue Sharing Program
Even though Forbes in its valuations factors in revenues earned from MLB’s Revenue Sharing Program, it is important to note the basics of revenue sharing and how teams potentially forfeit Program funds. MLB’s Revenue Sharing Program is a competitive balance mechanism that MLB first put into place in 1996.[94] Under the previous CBA, each team submitted thirty-four percent (34%) of their net local revenue from the prior revenue sharing year to a pool that was then divided equally among the teams.[95] This thirty-four percent (34%) sharing was called the “Base Plan.”[96] The other revenue sharing plan, the “Supplemental Plan,” grouped the teams into two categories: (1) Contributors (those teams with a Positive Performance Factor) and (2) Recipients (teams with a Negative Performance Factor).[97] The Performance Factors, expressed in percentages, are listed in Attachment 26 of the CBA.[98]
However, the top fifteen teams by market rank could have been disqualified from the Revenue Sharing Program in the 2013 through 2016 seasons.[99] In 2016, a team in the top fifteen markets could have forfeited 100 percent (100%) of the net revenue sharing proceeds (unless exempted) that they would have received under the combination of the Base Plan and the Supplemental Plan.[100] According to the previous CBA, the following chart shows the market rank of every MLB team:[101]
| Market Rank | Team(s) |
| 1 | New York Yankees and New York Mets |
| 3 | Los Angeles Dodgers and Los Angeles Angels |
| 5 | Chicago Cubs and Chicago White Sox |
| 7 | San Francisco Giants and Oakland Athletics |
| 9 | Toronto Blue Jays, Philadelphia Phillies, and Boston Red Sox. |
| 12 | Washington Nationals |
| 13 | Atlanta Braves and Texas Rangers |
| 15 | Houston Astros |
| 16 | Seattle Mariners |
| 17 | Detroit Tigers |
| 18 | Arizona Diamondbacks |
| 19 | Minnesota Twins |
| 20 | Baltimore Orioles |
| 21 | Colorado Rockies |
| 22 | San Diego Padres |
| 23 | Miami Marlins |
| 24 | Tampa Bay Rays |
| 25 | Cleveland Indians |
| 26 | St. Louis Cardinals |
| 27 | Kansas City Royals |
| 28 | Cincinnati Reds and Pittsburgh Pirates |
| 30 | Milwaukee Brewers |
The new 2017–2021 CBA kept the same revenue sharing structure as the previous CBA with two exceptions: (1) the formula by which individual team’s revenue sharing treatment is determined has been revised and (2) “[t]he number of market disqualified [teams] will be reduced from [fifteen] to [thirteen], with Oakland phased-out over four years beginning in 2017.”[102] Considering the Revenue Sharing Program, an MLB team that is in the bottom seventeen of MLB’s market rank may be more attractive to buyers and drive up the sales price. By acquiring a MLB team in the bottom seventeen of the market rank, the owners will not forfeit any revenue they earned from MLB’s Revenue Sharing Program. However, teams like the Yankees and the Dodgers will forfeit all of their net revenue sharing proceeds that they would otherwise be entitled to.
- Actual Reported Sales of MLB Teams
An ideal way to actually determine an MLB team’s value is to look at actual sales of MLB teams. In theory, these reported sales are considered “arm’s length” transactions and the price represents a team’s fair market value at the time of the sale. Since 2010, these MLB teams have been sold for the following reported sales prices:
| MLB Franchise | Year | Reported Purchase Price | Forbes Value Prior to Purchase | Difference Between Purchase Price and Forbes Valuation |
| Los Angeles Dodgers[103] | 2012 | $2 billion | $1.4 billion | $600 million |
| San Diego Padres[104] | 2012 | $600 million | $458 million | $142 million |
| Houston Astros[105] | 2011 | $465 million | $475 million | $(10 million) |
| Texas Rangers[106] | 2010 | $593 million | $451 million | $142 million |
Except for the Astros, the buyers for the Dodgers, Padres, and Rangers overpaid for their respective teams in comparison to Forbes valuations.
- The Creation of New State-of-the-Art Facilities
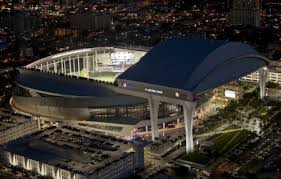 Although Forbes factors in the value of a team’s stadium as one of the four key metrics in their criteria for determining a team’s value, the numbers are likely understated. During the 1990s and early 2000s, there was a MLB stadium boom.[107] During this boom, MLB and its teams addressed the issue of aged, outdated stadiums by constructing fifteen new stadiums over a course of fourteen years.[108] Under Selig’s reign as Acting and Full-time Commissioner (1992–2015), the following stadiums were opened:[109]
| Stadium | Team | Year Opened | Percentage of Public Financing |
| Chase Field | Arizona Diamondbacks | 1998 | 75% |
| Turner Field | Atlanta Braves | 1997 | 100% |
| Great American Ball Park | Cincinnati Reds | 2003 | 96% |
| Progressive Field | Cleveland Indians | 1994 | 82% |
| Coors Field | Colorado Rockies | 1995 | 75% |
| Comerica Park | Detroit Tigers | 2000 | 38% |
| Minute Maid Park | Houston Astros | 2000 | 68% |
| Marlins Park | Miami Marlins | 2012 | 76% |
| Miller Park | Milwaukee Brewers | 2001 | 71% |
| Target Field | Minnesota Twins | 2010 | 72% |
| Citi Field | New York Mets | 2009 | 19% |
| Yankee Stadium | New York Yankees | 2009 | 32% |
| PNC Park | Pittsburgh Pirates | 2001 | 85% |
| Citizens Bank Park | Philadelphia Phillies | 2004 | 50% |
| Busch Stadium | St. Louis Cardinals | 2006 | 12% |
| Petco Park | San Diego Padres | 2004 | 66% |
| AT&T Park | San Francisco Giants | 2000 | 0% |
| Safeco Field | Seattle Mariners | 1999 | 76% |
| Globe Life Park | Texas Rangers | 1994 | 71% |
| Nationals Park | Washington Nationals | 2008 | 100% |
Additionally, the Atlanta Braves’ new stadium, SunTrust Park, was announced under Commissioner Selig’s tenure, and the stadium will replace Turner Field in 2017.[110] The public will contribute $329 million towards the $672 million ballpark, thereby financing fifty-eight percent (58%) of the cost.[111]
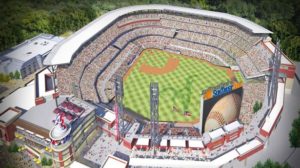 Ballparks have the ability to act as the epicenter of a community. This is known as the “edifice theory,” which states “that a new facility can be more than merely the home for the team. It can become the focal point for community development by encouraging commercial and residential interests to move into the area.”[112] For example, surrounding Miller Park in Milwaukee and along Miller Park Way are numerous commercial establishments such as Target, Wal-Mart, restaurants, and retail shopping in addition to local housing.[113] These features bring in a substantial amount of money to the community, where historical figures suggest that every dollar spent on a stadium brings in $1.75 for the local economy.[114] Additionally, if a team develops their own stadium district, they will generate more revenue. These additional income streams are not related to the business of baseball, but come as a result of operating a stadium district¾a real estate project. It should be noted that revenues generated by a stadium district are not subject to MLB’s Revenue Sharing Program. A new stadium is also good for the local economy, where a stadium can create jobs, community benefits, and become a revenue generator by means of taxation and tourism dollars. Having a profitable stadium district is attractive for a team and should be factored into the stadium’s overall value, and not just the net book value or appraisal value of the stadium.
Most of the stadiums constructed during Selig’s term were publically financed. In most instances, the MLB team, through its leasehold relationship, gained management control of the facility and most of the revenues accrued to the MLB team, making it a very profitable operation. According to Sports Facility Reports, the average public-private funding ratio during the Selig Commissionership for a MLB stadium was sixty-two percent (62%) public and thirty-eight percent (38%) private.[115] Most MLB teams, however, are responsible for all of the stadium’s operating expenses. This arrangement is normally laid out in a document, such as the “Lease Agreement,” between the team and the stadium authority.[116]
- Ticket Sales and Stadium Attendance
Paid attendance is a crucial source of revenue for any MLB team. Pursuant to the table below, over the past five seasons, on average, about 73.7 million fans attended a MLB game each year.[117] There is neither significant growth nor loss with MLB attendance; it has been stable. If you cannot achieve significant attendance growth, the next best thing to have is stable attendance and increased ticket prices to generate increased ticket revenues. If attendance figures continue to remain stable, teams will have to enhance their focus on yield. Yield focuses on targeted ticket revenue mechanisms, such as dynamic pricing, in order to maximize ticket revenue. Dynamic pricing is a pricing mechanism “that uses algorithms to measure demand and price sensitivity to a particular game on a real-time basis.”[118] Dynamic pricing considers several factors, such as a winning record, a player’s statistical streak (e.g. hitting streak), a particular MLB team, a particular player, a top prospect’s Major League debut, weather conditions, and ticket prices on the secondary market (e.g. StubHub).[119] After receiving assistance from pricing consultants, the MLB team decides if they want to increase or decrease ticket prices, and if so, by how much.[120] Simply put, if the team is seeing that their ticket revenue is increasing and has positive growth, attendance is not a major concern.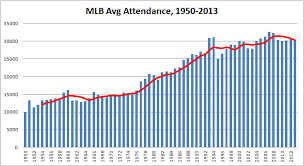
The table below shows that about 73.2 million people attended a MLB game during the 2016 season, which is a slight decrease from the 73.8 million people who attended a game during the 2015 season. The average price per ticket during the 2015 season was $28.94.[121] Taking the average price per ticket in 2015, multiplied by the 2015 attendance, MLB earned approximately $2.1 billion in ticket revenue during the 2015 season. Net revenues from ticket sales are subject to MLB’s Revenue Sharing Program as well.[122]
MLB Attendance Figures (2012–2016)[123]
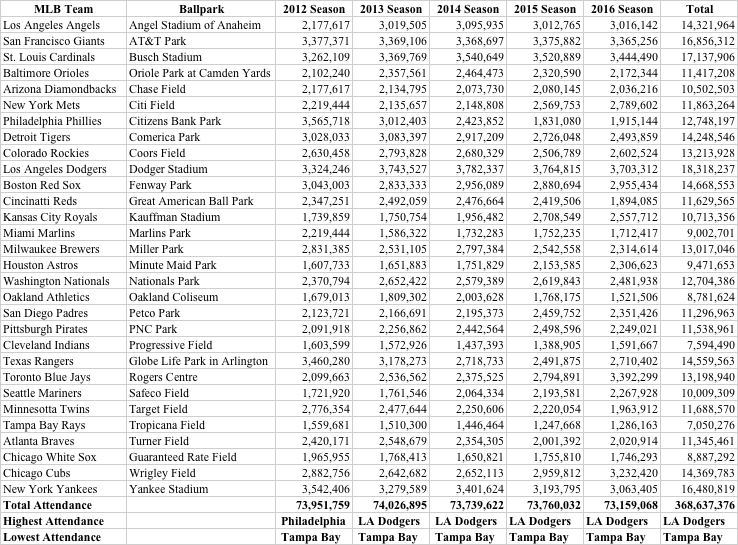
Average MLB Attendance (2012–2016): 73,727,475
- Labor Peace
The American sports fan has been treated to day-to-day acrimony and continuing headlines between representatives of labor management battling for a greater percentage of the pie and protecting their own self-interests. When doing so, the parties run the risk of a work stoppage. The last MLB work stoppage occurred on August 12, 1994, which resulted in cancelling the remainder of both the regular season, as well as the postseason, including the World Series.[124] This event brought baseball to its lowest moment. The owners attempted to use replacement players, but this strategy proved to be unsuccessful.[125] The work stoppage began on August 12, 1994, and was suspended on April 2, 1995, after 232 days and 948 games were lost without a salary cap.[126] Each MLB team was able to play 144 games that year.[127] This marked the fourth strike in the MLB in the last twenty-two years, which was the longest work stoppage in MLB history.[128] The MLB rose out of the ashes from what has been referred to as former Commissioner Selig’s “darkest moment” during his tenure.[129]
Major League Baseball has recognized that its system – while not perfect – is acceptable to grow the sport economically and is in the best interests of the game. Labor peace brings success, and success brings labor peace, and most of that success rests on the shoulders of the commissioner, Bud Selig.
Interleague play, expansion, three-division formats, an extra tier of playoffs and the wild card, realignment, the unbalanced schedule, limited instant replay and the World Baseball Classic have been some of his accomplishments that have made baseball a better game.
Selig also has engineered economic reforms in the form of debt service rules, expansion of revenue sharing, and the introduction of the luxury tax that have made the sport of baseball a stable economic enterprise.
At the end of the new Basic Agreement, baseball will have gone 21 years without a strike or lockout – the longest period of labor peace since the inception of collective bargaining in the sport. Certainly, the power of the commissioner and respect for Selig has had something to do with this, but it is economic prosperity that also brings labor peace. Baseball’s numbers are amazing.[130]
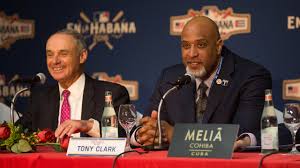 Baseball recently completed two decades of labor peace and has started progress towards a third decade. The previous CBA expired on December 1, 2016, and MLB and the MLBPA struck a new agreement the night before the expiration.[131] The new CBA is five years in length and will last from 2017 to December 1, 2021.[132] This was the first CBA negotiation for both MLBPA Executive Director Tony Clark and current MLB Commissioner Rob Manfred in their new roles.[133] Both MLB and the MLBPA were optimistic all along that an agreement would be reached, and by the time this new CBA expires, baseball will have sustained twenty-seven consecutive years of labor peace.[134] Labor peace, and a harmonious relationship between both MLB and the MLBPA, is good for the game of baseball because of the positive effects on revenues, MLB’s brand, and the sport’s popularity.
- The Psychic Value of Owning a MLB Team
Baseball is America’s pastime and one of its most beloved institutions. Owning a MLB franchise permits the owner to become part of a very exclusive club since there are currently only thirty MLB franchises. These franchises do not come readily available for sale; they are held by their owners for long periods of time and essentially become a most favored asset that is most difficult to replicate. The pure “psychic value” of owning an MLB team and becoming one of thirty has always been an unspoken reason why a wealthy person would want to become part of the exclusive club. With team values increasing in recent years, franchise acquisition has now become a game of billionaires, rather than millionaires.[135]
Currently, nine billionaires own an MLB franchise.[136] Across all of the major professional sports leagues, sixty-three billionaires own a team.[137] These sixty-three billionaires collectively own eighty-one teams across seven sports in twelve different leagues.[138] Combined, this elite group has accumulated $285 billion in wealth.[139] According to ESPN, billionaire owners in MLB include:
Ted Lerner of the Washington Nationals ($5.5B), . . . [Michael] Ilitch [of the Detroit Tigers ($4.8B)], San Francisco Giants owner Charles Johnson ($4.6B), Philadelphia Phillies owner John Middleton ($2.7B), Oakland Athletics owner John Fisher ($2.2B), Los Angeles Dodgers owner Mark Walter ($2.2B), Los Angeles Angels owner Arte Moreno ($1.8B), Texas Rangers owner Ray Davis ($1.7B) and Chicago White Sox owner Jerry Reinsdorf [($1.3B)].[140]
With billionaires participating in the bidding process, the competitive values of MLB teams’ purchase prices have increased, and as a result, a premium is paid to be an owner.
- Internationalization of the Game: The World Baseball Classic
 MLB has recently attempted to expand its brand and products outside of the United States. The most notable step towards international recognition has been the World Baseball Classic (WBC), another Selig brainchild. The WBC is an international baseball tournament that is sanctioned by the International Baseball Federation, and is supported by many professional baseball leagues and entities around the globe, such as MLB, the MLBPA, Nippon Professional Baseball (Japan), and the Korea Baseball Organization (South Korea).[141] The WBC was designed to grow the game internationally.[142] The inaugural WBC was held in March of 2006, and the Championship Round was hosted at Petco Park in San Diego, California.[143] The event has been described as “the most important baseball event ever held. The tournament, won by Japan, marked the first time that Major League players competed for their home countries.”[144] Since the 2009 tournament, the WBC has occurred every four years, with the next tournament taking place this spring (2017) with Dodger Stadium in Los Angeles, California hosting the Championship Round.[145] The WBC features top talent from around the world, and several of the international players have transitioned into MLB, such as former Boston Red Sox’ Starting Pitcher Daisuke Matsuzaka (Japan), New York Mets infielder José Reyes (Dominican Republic), and New York Mets Outfielder Yoenis Céspedes (Cuba).[146] No doubt that players such as these have allowed MLB to tap into international markets that follow these players and expand MLB’s brand internationally. In addition to the WBC, MLB is reportedly entertaining the idea of establishing expansion franchises outside the United States and Canada. Some MLB season-opening games have been played overseas in countries such as Japan and Australia.[147] International expansion to cities such as San Juan, Puerto Rico and Mexico City, Mexico are in consideration if the game does expand beyond the United States and Canada.[148] Overall, MLB team values will continue to increase because of the additional revenues that are produced because of the internationalization of the game.
- Favorable Economic Ratings from Fitch Show the Viability of MLB’s Debt and Credit Line
 Fitch Ratings has reaffirmed MLB’s “A” rating on the league’s $1.05 billion senior secured revolving credit facility and the $955 million in term notes.[149] An “A” rating from Fitch signifies that the entity has a low risk of default, and that the entity has a strong capacity to pay its financial commitments unless adverse business or economic conditions arise.[150] Overall, Fitch considers MLB as a “stable” entity,[151] and cites the success of MLB’s unique operating model and environment.[152] The renewed national television contracts in 2012, along with the success of MLBAM and the Revenue Sharing Program, have increased the financial health of each MLB team.[153] Fitch also points to MLB attendance figures, corporate support, and league-level sponsorship and advertising as other components that merited the league’s “A” rating.[154] Further, Fitch touts MLB’s current labor peace, strong internal governance, solid legal covenants, history of television contracts, flexibility to refinance outstanding debt, and performance among its professional sports peers as factors that played into the rating as well.[155]
The most recent Fitch ratings do not take into consideration the extended labor peace by virtue of the newly executed labor agreement or new national television packages that have further increased the value of a MLB team. According to Fitch Ratings, “one of the three nationally recognized statistical rating organizations designated by the United States Securities and Exchange Commission,”[156] acquiring and investing in a MLB team is considered a safe investment for a buyer.
The Hometown Perspective: Milwaukee Brewers
 As mentioned earlier, Forbes valued the Brewers at $875 million, and rated the team the 24th most valuable franchise.[157] The Brewers’ current owner, Mark Attanasio, purchased the team for $223 million in 2005, and his franchise has reportedly appreciated in value by $652 million, or about 300 percent (300%), in the past twelve years according to Forbes.[158] The Brewers are one of the small-market teams that benefit from MLB’s Revenue Sharing Program, and as a result of being in the smallest market and not having a high payroll, the Brewers do not have to worry about either being disqualified from any distributions or having their distributions reduced. The team has a good attendance turnout, where on average, about 2.6 million fans have attended Miller Park annually over the last five years.[159] However, since the Brewers are in the middle of a rebuilding process, attendance was down nine percent and television ratings for Brewers games were down twenty-five percent in 2016.[160]
On the bright side, if the rebuilding process is successful in Milwaukee, the Brewers’ value could receive a significant boost. A young, winning team that has long-term control over several quality players could drive up attendance figures. In 2011, the Brewers had over three million fans in attendance, and the driver behind that was a National League Central Division championship team that went far in the playoffs until they fell to the St. Louis Cardinals in six games of the National League Championship Series.[161] Also, a potentially new, more lucrative television contract will be another result of a successful rebuild. Currently, the Brewers receive $20 million annually in annual rights fees from a Fox Sports Wisconsin agreement set to expire at the end of 2019.[162] The Brewers have one of the lowest annual rights fees in all of baseball, which is partly due to having the smallest TV market in MLB.[163] With a successful rebuild, they will have the leverage to obtain a more lucrative local television contract.
So what can the Brewers do to increase their franchise value? Create new, non-baseball related, revenue streams. This involves going outside the Brewers’ core business of hosting baseball games. Non-baseball related revenue streams include hosting concerts or other sporting events at Miller Park, developing land to create an entertainment district, and constructing housing near the stadium for future rental income. The key element here is to preserve Miller Park. If Miller Park is kept up-to-date and is still viewed as an attractive entertainment and leisure destination for Wisconsin residents and tourists, these new revenue streams are possible.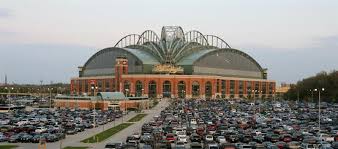
Overall, the Brewers could become more valuable based on MLB’s success alone. However, if their rebuilding process is successful, they will receive a significant boost in their value from attendance and television contract figures. As a result, Forbes should reward the Brewers with a higher team value because they would receive more revenue through MLB’s Revenue Sharing Program and their brand’s value will increase with a winning team. Despite some doubters, the Brewers could potentially be worth $1 billion someday and move up in the Forbes annual franchise value rankings.[164]
Milwaukee Brewers Yearly Franchise Values According to Forbes (2002–2016)
| Year | Value (in millions) | Rank |
| 2016[165] | $875 | 24 |
| 2015[166] | $875 | 21 |
| 2014[167] | $565 | 25 |
| 2013[168] | $562 | 22 |
| 2012[169] | $448 | 22 |
| 2011[170] | $376 | 22 |
| 2010[171] | $351 | 23 |
| 2009[172] | $347 | 24 |
| 2008[173] | $331 | 24 |
| 2007[174] | $287 | 26 |
| 2006[175] | $235 | 26 |
| 2005[176] | $208 | 25 |
| 2004[177] | $174 | 24 |
| 2003[178] | $206 | 23 |
| 2002[179] | $238 | 18 |
Conclusion
In conclusion, MLB franchise values are skyrocketing at an astounding rate. Guggenheim Baseball Management’s acquisition of the Dodgers for $2 billion started the trend by increasing every team’s value by thirty-five percent (35%) within one year. In addition to the four key metrics used by Forbes to determine the value of a MLB team, additional drivers such as television contracts with both national and regional sports networks, MLB’s Revenue Sharing Program, and MLBAM have helped skyrocket these values even further, and helped make up for the difference between Forbes’ valuations and the actual purchase prices. The economic reforms of Former MLB Commissioner Selig, architect of MLB’s Revenue Sharing Program and the Competitive Balance Tax, have made these increasing franchise values possible.[180] Selig has thus been responsible for the revenue growth MLB and its teams have experienced during his tenure as Commissioner.[181] Selig was an “economic giant,” and no doubt left his footprint on MLB and its teams’ future economic prosperity. Valuation fluxuation could be impacted by unknown elements such as TV deals, labor strikes, and economic recessions; however, with the game of baseball evolving and tapping into new opportunities for additional revenue streams, MLB franchise values will continue to skyrocket into the future.
Michael R. Gavin is currently a third-year law student at Marquette University, where he is focusing on Sports Law. In addition to being a 2017 Juris Doctor candidate, Gavin is also a 2017 Sports Law Certificate candidate at Marquette through the National Sports Law Institute. Gavin serves as Executive Editor of the Marquette Sports Law Review (Volume 27), and is a member of the Sports Law Society at Marquette. In January 2017, Gavin earned second place at the National Baseball Arbitration Competition located in New Orleans, Louisiana. Prior to Marquette, Gavin earned his bachelor of arts in Accounting from Washington & Jefferson College (Washington, PA), with a concentration in Entrepreneurial Studies. Outside of law school, Gavin is a practicing accountant, most recently at Building Control Parts, LLC, where he focuses on inventory control, and advises on financial matters and operational processes. Additionally, Gavin has interned at Deloitte in their tax practice, and continues to serve as a sports finance intern at Gamebreakers LLC in Milwaukee.
[1] Mike Oz, Is Baseball Dying? Nope, Actually the Values of MLB Teams Are Skyrocketing, Yahoo! Sports (Mar. 25, 2015), http://sports.yahoo.com/blogs/mlb-big-league-stew/is-baseball-dying–nope–actually-the-values-of-mlb-teams-are-skyrocketing-192424682.html.
[2] Los Angeles Dodgers on the Forbes MLB Team Valuations List, Forbes, http://www.forbes.com/teams/los-angeles-dodgers/ (last visited Nov. 14, 2016).
[3] Los Angeles Dodgers Sale to Guggenheim Group Finalized, ESPN (May 2, 2012), http://espn.go.com/los-angeles/mlb/story/_/id/7877983/los-angeles-dodgers-sale-guggenheim-group-finalized.
[4] Id.
[5] Steve Dilbeck, Dodgers’ Sale Increased Valuations of MLB Teams by 35%, L.A. Times (Oct. 24, 2013), http://articles.latimes.com/2013/oct/24/sports/la-sp-dn-increased-valuations-20131024.
[6] Oz, supra note 1.
[7] Mike Ozanian, Baseball Team Values 2014 Led by New York Yankees At $2.5 Billion, Forbes (Mar. 26, 2014), http://www.forbes.com/sites/mikeozanian/2014/03/26/baseball-team-values-2014-led-by-new-york-yankees-at-2-5-billion/#31125e995e79.
[8] Mike Ozanian, MLB Worth $36 Billion as Team Values Hit Record $1.2 Billion Average, Forbes (Mar. 25, 2015), http://www.forbes.com/sites/mikeozanian/2015/03/25/mlb-worth-36-billion-as-team-values-hit-record-1-2-billion-average/#56d8dd4b741e.
[9] Id.
[10] Id.
[11] Id.
[12] Baseball’s Most Valuable Teams – in Photos: The Most Valuable MLB Teams 2016, Forbes, http://www.forbes.com/pictures/mlm45gdfgj/baseballs-most-valuable/#61c1585e7f42 (last visited Nov. 14, 2016).
[13] The Business of Baseball – Full List, Forbes, http://www.forbes.com/mlb-valuations/list/#tab:overall (last visited Nov. 14, 2016).
[14] Id.
[15] Baseball’s Most Valuable Teams – in Photos: The Most Valuable MLB Teams 2016, supra note 12.
[16] Yankees Top Forbes’s MLB Valuation List for 19th Year in a Row, RT Sport (Mar. 25, 2016), https://www.rt.com/sport/337182-yankees-forbess-list-top/.
[17] Forbes Releases 19th Annual MLB Team Valuations, Forbes (Mar. 23, 2016), http://www.forbes.com/sites/forbespr/2016/03/23/forbes-releases-19th-annual-mlb-team-valuations/#4938a23f57c2.
[18] Net Debt Definition, Investopedia, http://www.investopedia.com/terms/n/netdebt.asp (last visited Nov. 14, 2016).
[19] Cash Equivalent Definition, AccountingTools, http://www.accountingtools.com/cash-equivalent-definition (last visited Aug. 2, 2016).
[20] Id.
[21] Id.
[22] New York Yankees on the Forbes MLB Team Valuations List, Forbes, http://forbeslabs.forbes.com/teams/new-york-yankees/ (last visited Nov. 14, 2016).
[23] Noah Jarosh, Can the Brewers Ever Place Much Higher in Forbes Franchise Values?, SB Nation: Brew Crew Ball (Mar. 28, 2014), http://www.brewcrewball.com/2014/3/28/5556204/forbes-mlb-franchise-values-brewers; John Beamer, The Value of Ball Clubs (Part 2), Hardball Times (Mar. 5, 2007), http://www.hardballtimes.com/measuring-managing-the-value-of-ballclubs-part-2/; Ozanian, supra note 8; Forbes Releases 19th Annual MLB Team Valuations, supra note 17; Ozanian, supra note 7; Shawn P. Roarke, Bruins Walk Off Fenway Field a Classic Winner, NHL (Jan. 1, 2010), https://www.nhl.com/news/bruins-walk-off-fenway-field-a-classic-winner/c-511978.
[24] Milwaukee Brewers on the Forbes MLB Team Valuations List, Forbes, http://www.forbes.com/teams/milwaukee-brewers/ (last visited Nov. 14, 2016).
[25] Id.
[26] Id.
[27] Jarosh, supra note 23.
[28] Id.
[29] Barney Carleton, MLB Teams Capitalize on Local Television Rights, Upper Deck Chatter (Jan. 4, 2014), https://upperdeckchatter.wordpress.com/2014/01/04/mlb-teams-capitalize-on-local-television-rights/.
[30] Id.
[31] Id.
[32] Commissioners, MLB, http://mlb.mlb.com/mlb/history/mlb_history_people.jsp?story=com_bio_9 (last visited Nov. 11, 2016).
[33] Id.; See The Growth of Major League Baseball Under the Leadership of Commissioner Selig, MLB (Sept. 26, 2013), http://m.mlb.com/news/article/61837204/the-growth-of-major-league-baseball-under-the-leadership-of-commissioner-selig/.
[34] Commissioners, supra note 32.
[35] Id.
[36] Id.
[37] Carleton, supra note 29.
[38] Id.
[39] Id.
[40] Id.
[41] Id.
[42] Id.
[43] Id.; Jim McLennan, Arizona Diamondbacks New TV Deal: $1.5 Billion Plus, SB Nation: AZ Snake Pit (Feb. 23, 2015), http://www.azsnakepit.com/2015/2/23/8097375/arizona-diamondbacks-tv-deal-1-5-billion; Ranking the MLB TV Deals, talkingredbirds (Dec. 1, 2015), http://talkingredbirds.com/2015/12/ranking-the-mlb-tv-deals-part-2/.
[44] Carleton, supra note 29.
[45] L.A. Ross & Tony Maglio, Your Unfair Cable Bill: Most Expensive Channels Aren’t the Most Watched, The Wrap (Mar. 13, 2014), http://www.thewrap.com/cable-network-carriage-fees/.
[46] Dave Warner, The High Cost of Regional Sports Networks, What You Pay for Sports (Apr. 17, 2013), http://www.whatyoupayforsports.com/2013/04/the-high-cost-of-regional-sports-networks/; Dave Warner, Regional Sports Networks, What You Pay for Sports (Apr. 5, 2016), http://www.whatyoupayforsports.com/category/regional-sports-networks/.
[47] Carleton, supra note 29.
[48] Id.
[49] Id.
[50] Doug Gray, Cincinnati Reds Sign New TV Deal, redsminorleague (Oct. 19, 2016), http://redsminorleagues.com/2016/10/19/cincinnati-reds-sign-new-tv-deal/.
[51] Bob Van Voris, MLB Settlement Gives Baseball Fans New Viewing Options, Bloomberg (Jan. 19, 2016), http://www.bloomberg.com/news/articles/2016-01-19/major-league-baseball-settles-with-fans-over-game-telecasts.
[52] Id.
[53] Jacob Emert, MLB TV Settlement Is “Big Win for Baseball Fans,” Wash. Post (Jan. 19, 2016), https://www.washingtonpost.com/news/early-lead/wp/2016/01/19/mlb-tv-settlement-is-big-win-for-baseball-fans/.
[54] Van Voris, supra note 51.
[55] Id.
[56] Id.
[57] MLB ADVANCED MEDIA, L.P.: Quotes and News, Google Finance, https://www.google.com/finance?cid=6016811 (last visited Nov. 14, 2016).
[58] Id.
[59] Id.
[60] Id.
[61] Maury Brown, 2016 MLB Advanced Media Revenues Projected to Reach $1.1-$1.2 Billion, Forbes (Mar. 3, 2016), http://www.forbes.com/sites/maurybrown/2016/03/03/mlb-advanced-media-projected-revenues-to-be-1-1-1-2-billion-in-2016/#4a4c81f67236.
[62] Maury Brown, Disney Buys $1B Stake in MLB’s BAMTech, to Launch ESPN Streaming Service, Forbes (Aug. 9, 2016), http://www.forbes.com/sites/maurybrown/2016/08/09/disney-co-makes-1-billion-investment-becomes-minority-stakeholder-in-mlbams-bamtech/#38ecaba51597.
[63] NHL Public Relations / NHL.com, Commissioners Bettman, Manfred Announce Historic Media Rights Partnership Between NHL, MLBAM, NHL (Aug. 4, 2015), https://www.nhl.com/news/commissioners-bettman-manfred-announce-historic-media-rights-partnership-between-nhl-mlbam/c-776247.
[64] Id.
[65] Id.
[66] Id.
[67] Maury Brown, How Major League Baseball Continues Massive Growth with Addition of BAMTech Europe, Forbes (Nov. 1, 2016), http://www.forbes.com/sites/maurybrown/2016/11/01/how-major-league-baseball-continues-massive-growth-with-addition-of-bamtech-europe/#431a2fe64fa3.
[68] Id.
[69] Id.
[70] Id.
[71] Id.
[72] Martin J. Greenberg, Major League Baseball Competitive Balance Tax, Sport$Biz (July 15, 2015), https://greenberglawoffice.com/major-league-baseball-competitive-balance-tax/.
[73] Id.
[74] Id.
[75] Id.
[76] Greenberg, supra note 72.
[77] Id.
[78] Id.
[79] Id.
[80] Liz Roscher, It’s Time for Six MLB Teams to Pay Up on Their Luxury Tax Bills, SB Nation (Dec. 18, 2016), http://www.sbnation.com/mlb/2016/12/18/13996894/its-time-for-six-mlb-teams-to-pay-up-on-their-luxury-tax-bills.
[81] MLBPA, MLB Announce Details of New Labor Agreement, MLBPA (Dec. 2, 2016), http://www.mlbplayers.com/ViewArticle.dbml?DB_OEM_ID=34000&ATCLID=211336390.
[82] Id.
[83] Id.
[84] Id.
[85] Id.
[86] Greenberg, supra note 72.
[87] Id.
[88] Mike Bauman, Bauman: Commissioner Bud Selig’s Legacy Is One of ‘Hope and Faith’ for All Franchises, MLB (Jan. 1, 2013), http://m.mlb.com/news/article/40826526/bauman-commissioner-bud-seligs-legacy-is-one-of-hope-and-faith-for-all-franchises/.
[89] Greenberg, supra note 72.
[90] Id.
[91] Id.
[92] MLBPA, MLB Announce Details of New Labor Agreement, supra note 81.
[93] Id.
[94] Revenue Sharing, FanGraphs Sabermetrics Library, http://www.fangraphs.com/library/business/revenue-sharing/ (last visited Nov. 14, 2016).
[95] 2012–2016 Basic Agreement Between Major League Clubs and the Major League Baseball Players Association,
art. XXIV(A)(10), http://mlbplayers.mlb.com/pa/pdf/cba_english.pdf [hereinafter 2012–2016 Basic Agreement].
[96] Id.
[97] Id. art. XXIV(A)(13)(b).
[98] Id.
[99] Id. Attachment 26.
[100] Id. art. XXIV(A)(15).
[101] Id. Attachment 26.
[102] MLBPA, MLB Announce Details of New Labor Agreement, supra note 81.
[103] Los Angeles Dodgers on the Forbes MLB Team Valuations List, supra note 2.
[104] San Diego Padres on the Forbes MLB Team Valuations List, Forbes, http://www.forbes.com/teams/san-diego-padres/ (last visited Nov. 14, 2016).
[105] Houston Astros on the Forbes MLB Team Valuations List, Forbes, http://www.forbes.com/teams/houston-astros/ (last visited Nov. 14, 2016).
[106] Texas Rangers on the Forbes MLB Team Valuations List, Forbes, http://www.forbes.com/teams/texas-rangers/ (last visited Nov. 14, 2016).
[107] Phillip Miller, Private Financing and Sports Franchise Values: The Case of Major League Baseball, Minn. State Univ., http://krypton.mnsu.edu/~qp8847pw/papers/Public%20Funding%20and%20Sports%20Franchise%20Values.pdf (last visited Sept. 19, 2016).
[108] See id.
[109] Commissioners, supra note 32; Ballpark & Stadium Comparison – Opening of Current Ballparks, ballparksofbaseball, http://www.ballparksofbaseball.com/comparisons/current-ballpark-openings/ (last visited Nov. 12, 2016).
[110] SunTrust Park, ballparksofbaseball, http://www.ballparksofbaseball.com/ballparks/suntrust-park/ (last visited Nov. 12, 2016).
[111] Id.
[112] Id.
[113] Id.
[114] Frank A. Mayer, III, Stadium Financing: Where We Are, How We Got Here, and Where We Are Going, 12 Vill. Sports & Ent. L.J. 195, 212 (2005).
[115] Sports Facility Reports: Major League Baseball, Nat’l Sports L. Inst. Marq. Univ. L. Sch. (Aug. 12, 2015), https://law.marquette.edu/assets/sports-law/pdf/MLB.15.pdf.
[116] Amended and Restated Miller Park Lease Agreement By and Between Southeast Wisconsin Professional Baseball Park District and Milwaukee Brewers Baseball Club, Limited Partnership, Dated as of June 30, 2004, http://www.milwaukeemag.com/Media/Editorial/Staff%20Blogs/Web%20features/Miller%20Park%20Source%20Documents/2004%20Lease.pdf.
[117] 2010 – Present Ballpark Attendance Figures, Ballparks of Baseball, http://www.ballparksofbaseball.com/2010presentattendance.htm (last visited Nov. 14, 2016); 2015 MLB Attendance – Major League Baseball, ESPN, http://espn.go.com/mlb/attendance/_/year/2015 (last visited Aug. 3, 2016); 2016 MLB Attendance – Major League Baseball, ESPN, http://www.espn.com/mlb/attendance (last visited Dec. 3, 2016).
[118] Wendy Thurm, The Nuts and Bolts of Variable and Dynamic Pricing, FanGraphs Baseball (Jan. 9, 2013), http://www.fangraphs.com/blogs/the-nuts-and-bolts-of-variable-and-dynamic-pricing/.
[119] See id.
[120] Id.
[121] Associated Press, MLB Ticket Price Average up 3.3 Percent to $28.94; Boston Red Sox Highest at $52.34, Fox Bus. (Apr. 6, 2015), http://www.foxbusiness.com/markets/2015/04/06/mlb-ticket-price-average-up-33-percent-to-284-boston-red-sox-highest-at-5234.html.
[122] Maury Brown, Major League Preview: Revenue Sharing Is Making an Impact, BaseballAmerica (Mar. 2, 2010), http://www.baseballamerica.com/today/majors/season-preview/2010/269597.html.
[123] 2010 – Present Ballpark Attendance Figures, supra note 118; 2015 MLB Attendance – Major League Baseball, supra note 118; 2016 MLB Attendance – Major League Baseball, supra note 118.
[124] Bob Nightengale, 1994 Strike Most Embarrassing Moment in MLB History, USA Today (Aug. 11, 2014), http://www.usatoday.com/story/sports/mlb/2014/08/11/1994-mlb-strike/13912279/.
[125] Steven Marcus, Twenty Years Ago, Replacement Players Almost Opened Baseball Season, Newsday (Mar. 28, 2015), http://www.newsday.com/sports/baseball/twenty-years-ago-replacement-players-almost-opened-baseball-season-1.10142935.
[126] 1994–95 Major League Baseball Strike, Revolvy, https://www.revolvy.com/main/index.php?s=1994–95%20Major%20League%20Baseball%20strike (last visited Dec. 3, 2016).
[127] Id.
[128] 1994–95 Major League Baseball Strike, Wikipedia, http://en.m.wikipedia.org/wiki/1994-95_Major_League_Baseball_strike (last visited Dec. 27, 2016).
[129] Bud Selig’s Revolutionary Reign, ESPN, http://www.espn.com/espn/feature/story/_/id/12213250/bud-selig-revolutionary-reign (last visited Nov. 11, 2016).
[130] Martin J. Greenberg, Selig Deserves Credit for MLB Labor Peace, Milwaukee J. Sentinel (Nov. 26, 2011), http://archive.jsonline.com/news/opinion/selig-deserves-credit-for-mlb-labor-peace-selig-deserves-credit-for-mlb-labor-peace-bf3677g-134522478.html.
[131] Bob Nightengale, Major League Baseball, Union Agree on New Collective Bargaining Agreement, USA Today (Dec. 1, 2016), http://www.usatoday.com/story/sports/mlb/2016/11/30/mlb-collective-bargaining-agreement-lockout-union-luxury-tax/94701920/.
[132] Maury Brown, Breaking Down MLB’s New 2017-21 Collective Bargaining Agreement, Forbes (Nov. 30, 2016), http://www.forbes.com/sites/maurybrown/2016/11/30/breaking-down-mlbs-new-2017-21-collective-bargaining-agreement/#2460eb7742a1.
[133] Associated Press, Monday’s Roundup: Clark Expects Continued Peace, Detroit News (Mar. 14, 2016), http://www.detroitnews.com/story/sports/mlb/2016/03/14/mondays-roundup-clark-expects-continued-peace/81791696/.
[134] Id.; Nightengale, supra note 132.
[135] Kurt Badenhausen, The World’s Richest Sports Team Owners 2016, Forbes (Mar. 1, 2016), http://www.forbes.com/sites/kurtbadenhausen/2016/03/01/the-worlds-richest-sports-team-owners-2016/#20774e9775b2.
[136] Id.
[137] Id.
[138] Id.
[139] Id.
[140] Darren Rovell, Los Angeles Clippers Owner Steve Ballmer Leads Four Major Sports with Worth of $23.5 Billion, ESPN (Mar. 1, 2016), http://www.espn.com/moresports/story/_/id/14876441/los-angeles-clippers-owner-steve-ballmer-leads-four-major-sports-worth-235-billion.
[141] World Baseball Classic – BR Bullpen, Baseball-Reference, http://www.baseball-reference.com/bullpen/World_Baseball_Classic (last visited Nov. 11, 2016).
[142] Commissioners, supra note 32.
[143] World Baseball Classic – BR Bullpen, Baseball-Reference, http://www.baseball-reference.com/bullpen/World_Baseball_Classic (last visited Nov. 11, 2016).
[144] Commissioners, supra note 32.
[145] World Baseball Classic – BR Bullpen, supra note 144; David Adler, Dodger Stadium Will Host 2017 World Baseball Classic Final, World Baseball Classic (Aug. 25, 2016), http://www.worldbaseballclassic.com/news/article/197599642/.
[146] World Baseball Classic, Wikipedia, https://en.wikipedia.org/wiki/World_Baseball_Classic (last visited Dec. 27, 2016).
[147] Major League Baseball’s 2014 Opening Series Set for Sydney, Australia, MLB.com (June 12, 2013), http://m.mlb.com/news/article/50461452/major-league-baseballs-2014-opening-series-set-for-sydney-australia/.
[148] Jerry Crasnick, MLB 2.0: Reimagining Baseball – International Expansion Teams, ESPN (Jan. 22, 2016), http://www.espn.com/mlb/story/_/id/14620232/reimagining-baseball-international-expansion-teams.
[149] Fitch Affirms MLB Club Trust Securitization Senior Secured Credit Facility & Term Notes at ‘A,’ Bus. Wire (May 25, 2016), http://www.businesswire.com/news/home/20160525006537/en/Fitch-Affirms-MLB-Club-Trust-Securitization-Senior.
[150] Glossary of Fitch’s Rating Terms, CreditRiskMonitor, https://info.creditriskmonitor.com/Help/FitchGlossary.asp#LT-A (last visited Nov. 11, 2016).
[151] Fitch Affirms MLB Club Trust Securitization Senior Secured Credit Facility & Term Notes at ‘A’, supra note 150.
[152] Id.
[153] Id.
[154] Id.
[155] Id.
[156] Martin J. Greenberg & Michael R. Gavin, NFL G-3 and G-4 Credit Facility Has Made Possible New State-of-the-Art Stadiums, Greenberg L. Off.: Sport$Biz (Apr. 1, 2016), https://greenberglawoffice.com/nfl-credit-facility-has-made-possible-new-state-of-the-art-stadiums/.
[157] Milwaukee Brewers on the Forbes MLB Team Valuations List, supra note 24.
[158] Id.
[159] 2010 – Present Ballpark Attendance Figures, supra note 118; 2015 MLB Attendance – Major League Baseball, supra note 118; 2016 MLB Attendance – Major League Baseball, supra note 118.
[160] Rich Kirchen, Milwaukee Brewers TV Ratings Decline in 2016, Milwaukee Bus. J. (Oct. 6, 2016), http://www.bizjournals.com/milwaukee/news/2016/10/06/milwaukeebrewers-tv-ratings-decline-in-2016.html.
[161] 2011 MLB Attendance – Major League Baseball, ESPN, http://www.espn.com/mlb/attendance/_/year/2011 (last visited Nov. 11, 2016); 2011 Milwaukee Brewers Season, Wikipedia, https://en.wikipedia.org/wiki/2011_Milwaukee_Brewers_season (last visited Nov. 14, 2016).
[162] Carleton, supra note 29.
[163] See generally id.
[164] Jarosh, supra note 23.
[165] Milwaukee Brewers on the Forbes MLB Team Valuations List, supra note 24.
[166] Noah Jarosh, Brewers the 21st Most-Valuable MLB Franchise According to Forbes, SB Nation: Brew Crew Ball (Mar. 25, 2015), http://www.brewcrewball.com/2015/3/25/8288713/brewers-franchise-value-forbes-yankees.
[167] Mike Chiari, 2014 MLB Team Valuations Released by Forbes, Bleacher Report (Mar. 26, 2014), http://bleacherreport.com/articles/2006471-2014-mlb-team-valuations-released-by-forbes.
[168] 22. Milwaukee Brewers, Forbes, http://www.forbes.com/pictures/emeh45hmkg/22-milwaukee-brewers-2/#21324ac9447e (last visited Nov. 12, 2016).
[169] Robert Knapel, Milwaukee Brewers, Bleacher Report (Mar. 22, 2012), http://bleacherreport.com/articles/1115477-forbes-magazine-mlb-franchise-values-br-decides-what-each-is-really-worth/page/17.
[170] #22 Milwaukee Brewers, Forbes, http://www.forbes.com/lists/2011/33/baseball-valuations-11_Milwaukee-Brewers_337147.html (last visited Nov. 12, 2016).
[171] #23 Milwaukee Brewers, Forbes (Apr. 7, 2010), http://www.forbes.com/lists/2010/33/baseball-valuations-10_Milwaukee-Brewers_337147.html.
[172] #24 Milwaukee Brewers, Forbes (Apr. 22, 2009), http://www.forbes.com/lists/2009/33/baseball-values-09_Milwaukee-Brewers_337147.html.
[173] #24 Milwaukee Brewers, Forbes (Apr. 16, 2008), http://www.forbes.com/lists/2008/33/biz_baseball08_Milwaukee-Brewers_337147.html.
[174] Forbes Magazine’s Major League Baseball Franchise Value, Milwaukee J. Sentinel (Apr. 20, 2007). http://archive.jsonline.com/sports/brewers/29397249.html.
[175] Brewers Made $22.4M in 2005, Milwaukee Bus. J. (Apr. 21, 2006), http://www.bizjournals.com/milwaukee/stories/2006/04/17/daily43.html.
[176] Forbes’ MLB Valuations: Yankees’ Value Tops League by 69%, Sports Bus. Daily (Apr. 13, 2005), http://www.sportsbusinessdaily.com/Daily/Issues/2005/04/Issue-139/The-Back-Of-The-Book/Forbes-MLB-Valuations-Yankees-Value-Tops-League-By-69.aspx.
[177] MLB Valuations, Forbes (Apr. 26, 2004), http://www.forbes.com/free_forbes/2004/0426/066tab.html.
[178] MLB Team Valuations, Forbes (Apr. 28, 2003), http://www.forbes.com/free_forbes/2003/0428/mlb_23.html.
[179] MLB, Forbes (Apr. 15, 2002), http://www.forbes.com/free_forbes/2002/0415/092tab2_2.html.
[180] Greenberg, supra note 131.
[181] Id.


